


U.S. Grid Carbon Intensity · 2024 EIA Data
239×
The dirtiest U.S. power grid is 239 times more carbon-intense than the cleanest.
West Virginia: 1,912 lb CO₂/MWh vs Vermont: 8 lb CO₂/MWh
You went electric to shrink your footprint. So here's an uncomfortable truth: where you plug in can matter more than what you drive.
By the end of this guide you'll know exactly how clean (or dirty) your state's grid really is, which states top the rankings on both ends, and what the latest 2024–2025 data means for the carbon math of EVs and e-scooters.
Here's the deal: every number below traces to the U.S. Energy Information Administration or another official source — no vague studies show, and nothing older than 2024 presented as current.
1,912
Dirtiest grid · West Virginia (lb CO₂/MWh)
785
U.S. average grid (lb CO₂/MWh)
8
Cleanest grid · Vermont (lb CO₂/MWh)
What Grid Carbon Intensity by State Actually Means
Grid carbon intensity is the amount of carbon dioxide a state's power plants emit for every unit of electricity they produce — measured in pounds of CO₂ per megawatt-hour (lb CO₂/MWh). A low number means clean electricity from hydro, nuclear, wind, or solar. A high number means coal and gas.
According to the U.S. Energy Information Administration, the U.S. grid averaged 785 lb CO₂/MWh in 2024 across roughly 4.31 billion megawatt-hours generated (EIA State Electricity Profiles, 2024).
Now: that single national number hides an enormous gap between states — which is where the story gets interesting.
Grid Carbon Intensity by State (2024)
Pounds of CO₂ per megawatt-hour — verified states shown. Lower is cleaner.
West Virginia
1,912
Kentucky
1,744
Wyoming
1,724
U.S. average
785
Virginia
631
Vermont
8
Source: U.S. EIA State Electricity Profiles, 2024 · released Nov 10, 2025
How the Dirtiest & Cleanest State Grids Compare
Three coal-reliant states top the dirty list — West Virginia (1,912), Kentucky (1,744), and Wyoming (1,724) — while hydro-powered Vermont sits at just 8 lb CO₂/MWh (EIA, 2024). That's the 239× gap in a nutshell.
Why coal states rank highest
The pattern is simple: every grid near the top of the dirty list leans on coal, the most carbon-heavy fuel. Every grid near the bottom leans on renewables or a renewables-plus-nuclear mix.
What's the result? The same electric vehicle charged in West Virginia carries a far heavier carbon tail than one charged in Vermont — even though it's the identical car.
Where most people actually land
Most charging doesn't happen on the extreme grids. A data-center-heavy state like Virginia sat at 631 lb CO₂/MWh in 2024, comfortably below the coal outliers (EIA, 2024) — which is why the EVs just run on coal claim only holds in a handful of places.
⚠️ The 2025 twist: the grid may have gotten dirtier
After years of decline, U.S. power-sector emissions likely rose in 2025. With natural gas running about 40% pricier than 2024, utilities burned more coal and gas-fired generation fell roughly 3% — about 61 billion kWh (EIA Short-Term Energy Outlook, 2025). EIA expects emissions to resume falling 2.2% in 2026 (EIA STEO, 2026), so it reads as a one-year fuel-price blip — not a trend break.
What Grid Carbon Intensity by State Means for EVs & E-Scooters
Even on the dirtiest grid, going electric still wins — and the lighter your vehicle, the faster it wins. Across all U.S. states, driving an EV cuts CO₂ by about 66% versus a gas car on average, because an EV uses roughly half the energy (Climate Central, 2025).
Now here's the part that matters for commuters: an e-scooter uses a tiny fraction of the energy a car does. So on any state grid — including West Virginia, Kentucky, and Wyoming — swapping short car trips for an electric scooter cuts your carbon immediately, no waiting for the grid to clean up.
The best part? You control that choice today, while the grid decarbonizes on its own timeline.
Replace the short car trips first
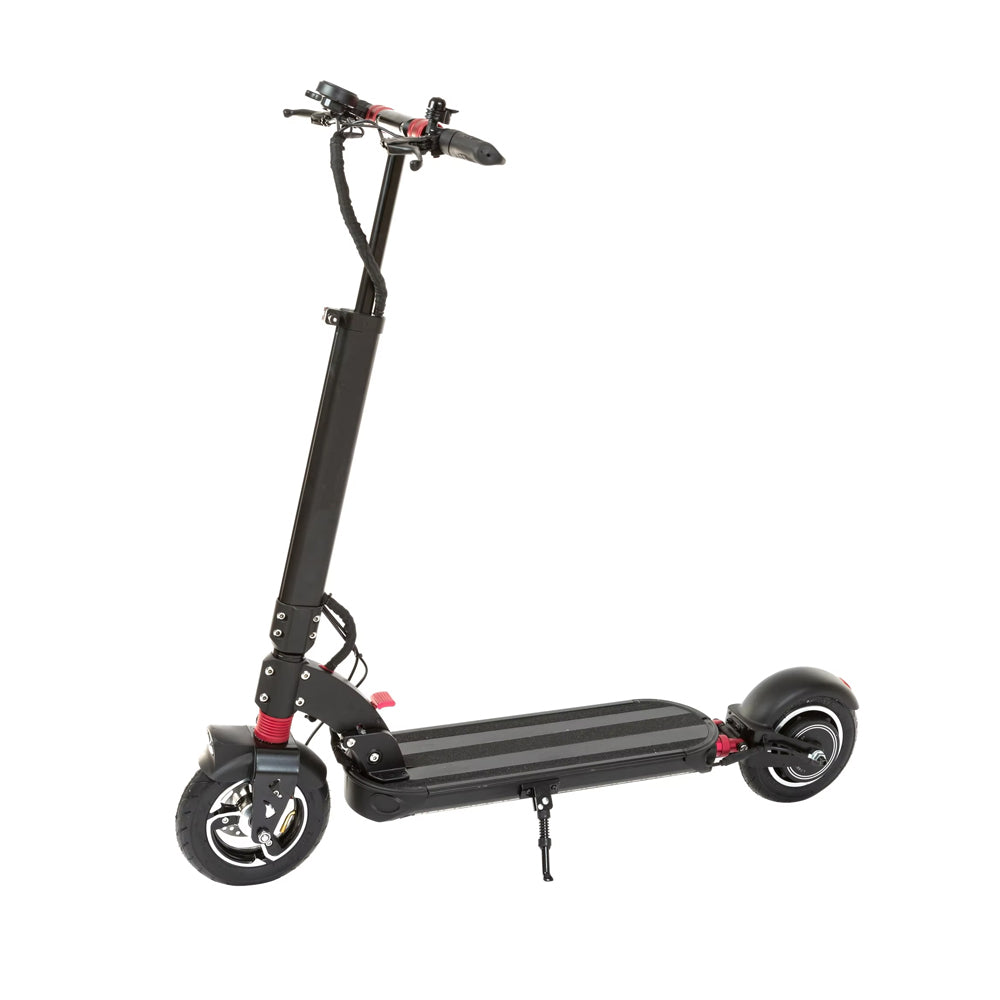
The Zero 9 30 mph electric scooter covers most daily commutes on a sliver of the energy a car burns — so your per-mile carbon drops the moment you switch, on any grid.
View the Zero 9 →Want a gentler, equally efficient option for tighter city riding? The Zero 8 25 mph electric scooter makes the same emissions case in a more compact, beginner-friendly package.
📌 Cite this data
Writing about EV emissions or grid carbon? Feel free to reference these figures — a link back is appreciated.
U.S. grid carbon intensity ranged from 8 lb CO₂/MWh (Vermont) to 1,912 lb CO₂/MWh (West Virginia) in 2024 — a 239× gap — against a national average of 785 lb CO₂/MWh. Source: DRIDER Scooters analysis of U.S. EIA State Electricity Profiles (2024). https://www.driderescooters.com/blogs/news/grid-carbon-intensity-by-state
Grid Carbon Intensity by State: FAQ
Which U.S. state has the cleanest electricity grid?
Vermont has the cleanest grid, at just 8 lb CO₂/MWh in 2024, thanks to a hydro-dominant mix and large electricity imports (EIA State Electricity Profiles, 2024). Washington, Oregon, and Idaho also rank among the cleanest, all renewables-heavy.
Which state has the dirtiest electricity grid?
West Virginia had the dirtiest grid in 2024 at 1,912 lb CO₂/MWh, followed by Kentucky (1,744) and Wyoming (1,724) — all coal-primary states (EIA, 2024).
What is the average grid carbon intensity in the U.S.?
The U.S. grid averaged 785 lb CO₂/MWh in 2024 (EIA State Electricity Profiles, 2024). That's well below the coal-state outliers, which is why most charging is cleaner than people assume.
Are EVs still cleaner than gas cars on a dirty grid?
Yes. Even in coal-heavy states, an EV beats a comparable gas car over its lifetime, and on average across all states it cuts CO₂ by about 66% (Climate Central, 2025). An e-scooter wins even faster because it uses a fraction of the energy.
Is there 2025 grid carbon intensity data by state?
Not yet. EIA's state-level 2024 data was released in November 2025, and 2025 state figures aren't due until November 2026. National 2025 estimates from EIA's Short-Term Energy Outlook suggest emissions ticked up as utilities burned more coal.
Why does grid carbon intensity vary so much between states?
It comes down to fuel mix. Coal emits the most CO₂ per megawatt-hour, so coal-reliant grids rank dirtiest, while states running on hydro, nuclear, wind, and solar rank cleanest — a difference of up to 239× in 2024.
The Bottom Line on Grid Carbon Intensity by State
Bottom line: your electricity is only as clean as your state, and in 2024 that ranged from near-zero in Vermont to 1,912 lb CO₂/MWh in West Virginia. But you don't have to wait on the grid — choosing a lighter electric ride like the Zero 9 30 mph electric scooter cuts your carbon today, wherever you live.
Sources & further reading
- U.S. Energy Information Administration, State Electricity Profiles (2024 data, released Nov 10, 2025) — eia.gov/electricity/state
- U.S. Energy Information Administration, Short-Term Energy Outlook (2025–2026) — eia.gov/outlooks/steo
- Climate Central, Electric Vehicle Charge Up (2025) — climatecentral.org
Last updated: June 2026 · Figures: U.S. EIA, 2024 (latest available). State-level 2025 data not yet released.
Our Products


ZERO 9 Scooter
$799.00
Electric Scooter for Commuting in USA | Shop Now
$999.99